

This week, the community turned its attention to structure, making sense of long outputs, rendering data properly, and sharing work without the usual...
This week, the community turned its attention to structure, making sense of long outputs, rendering data properly, and sharing work without the usual formatting casualties. Three tools made the cut.
Editor's Picks#
Three tools that solve real problems this week.
@Fu-Jie's Smart Mind Map#

You're three paragraphs into a brainstorming response and you've already forgotten what the first point was. You scroll up, lose your place, scroll down, try to hold the whole thing in your head. By the time you've parsed the structure, you're too tired to act on it.
This action extracts the conceptual skeleton from any response and renders it as an interactive mind map in a sidebar. Nodes, edges, hierarchy, all derived automatically. You can collapse branches, rearrange, and export to PNG or SVG.
Useful for planning sessions, document analysis, or any time you want to see the shape of an idea rather than read through it linearly.
@colton's Visuals Toolkit#
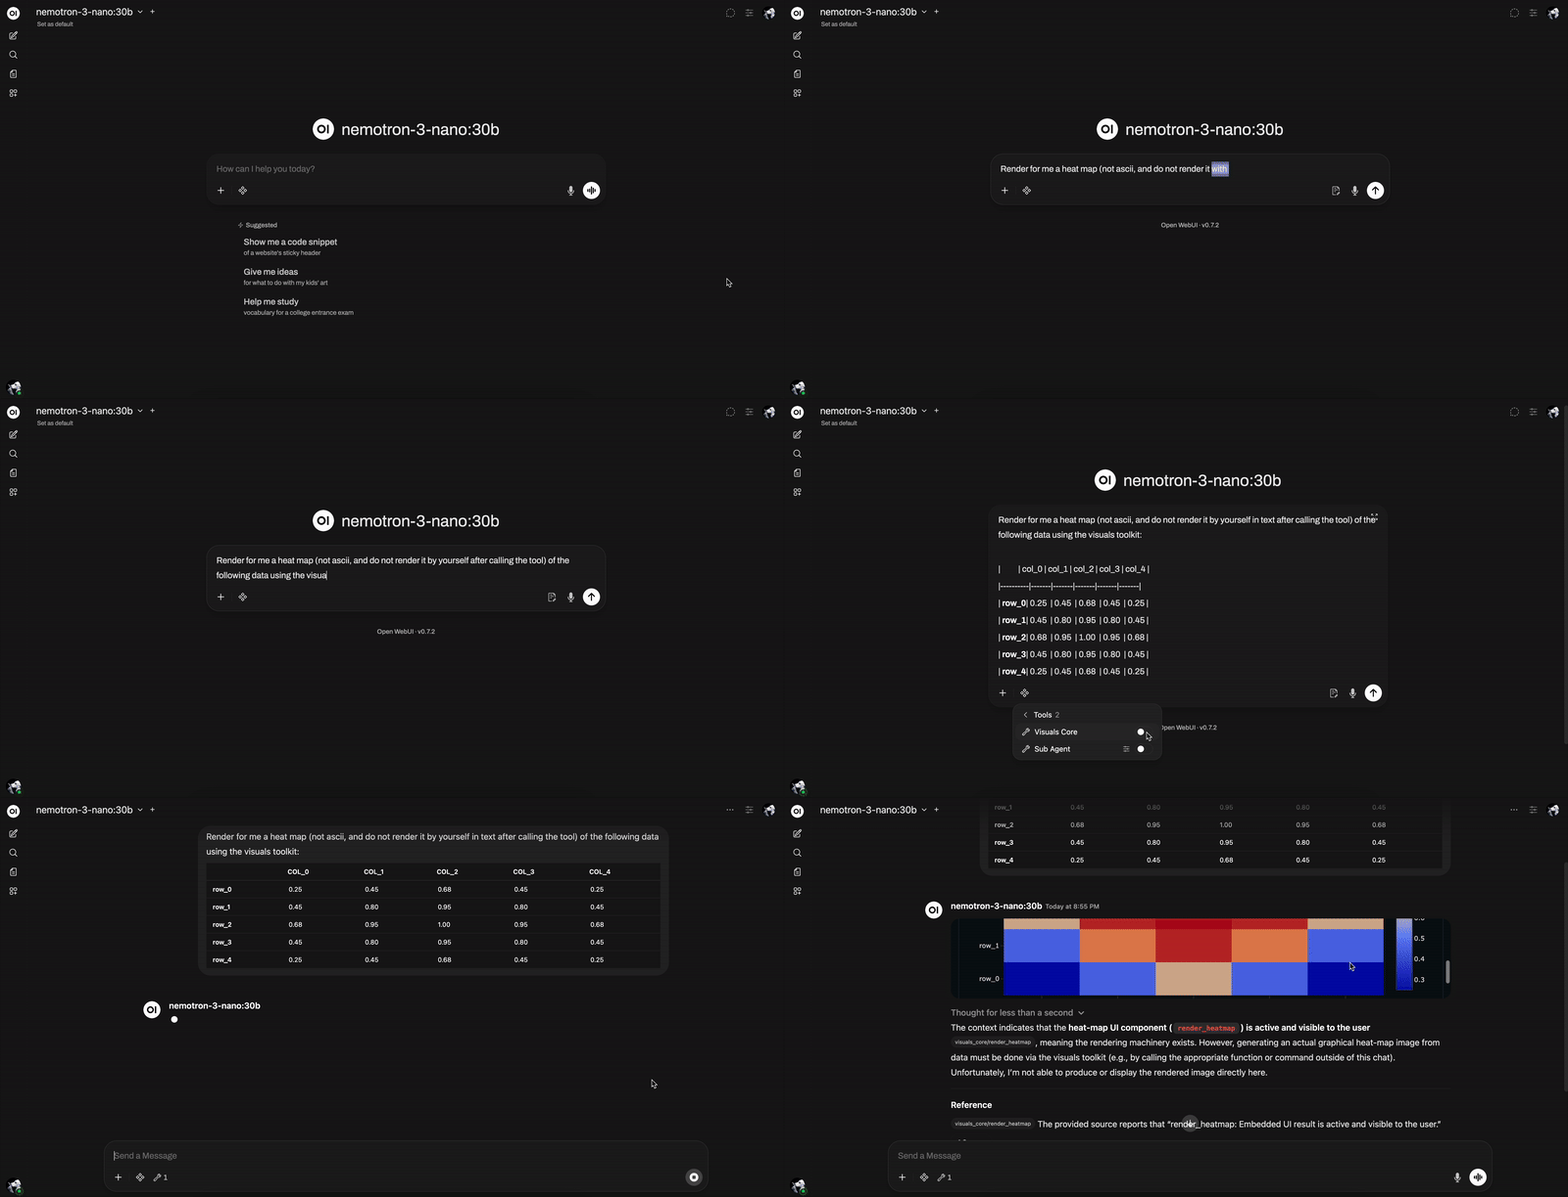
You ask the model for a simple bar chart. It responds with a block of characters that might, if you squint, resemble bars. Or it describes the chart in words: "The first bar is approximately twice the height of the second bar." You paste this into a doc and your colleague asks, "What am I looking at?"
This toolkit gives your model actual rendering tools: tables, line graphs, bar charts, heat maps. The model describes the data; the computer draws it properly.
If you work with data regularly, this should already be installed.
@g30's Forward to Channel#
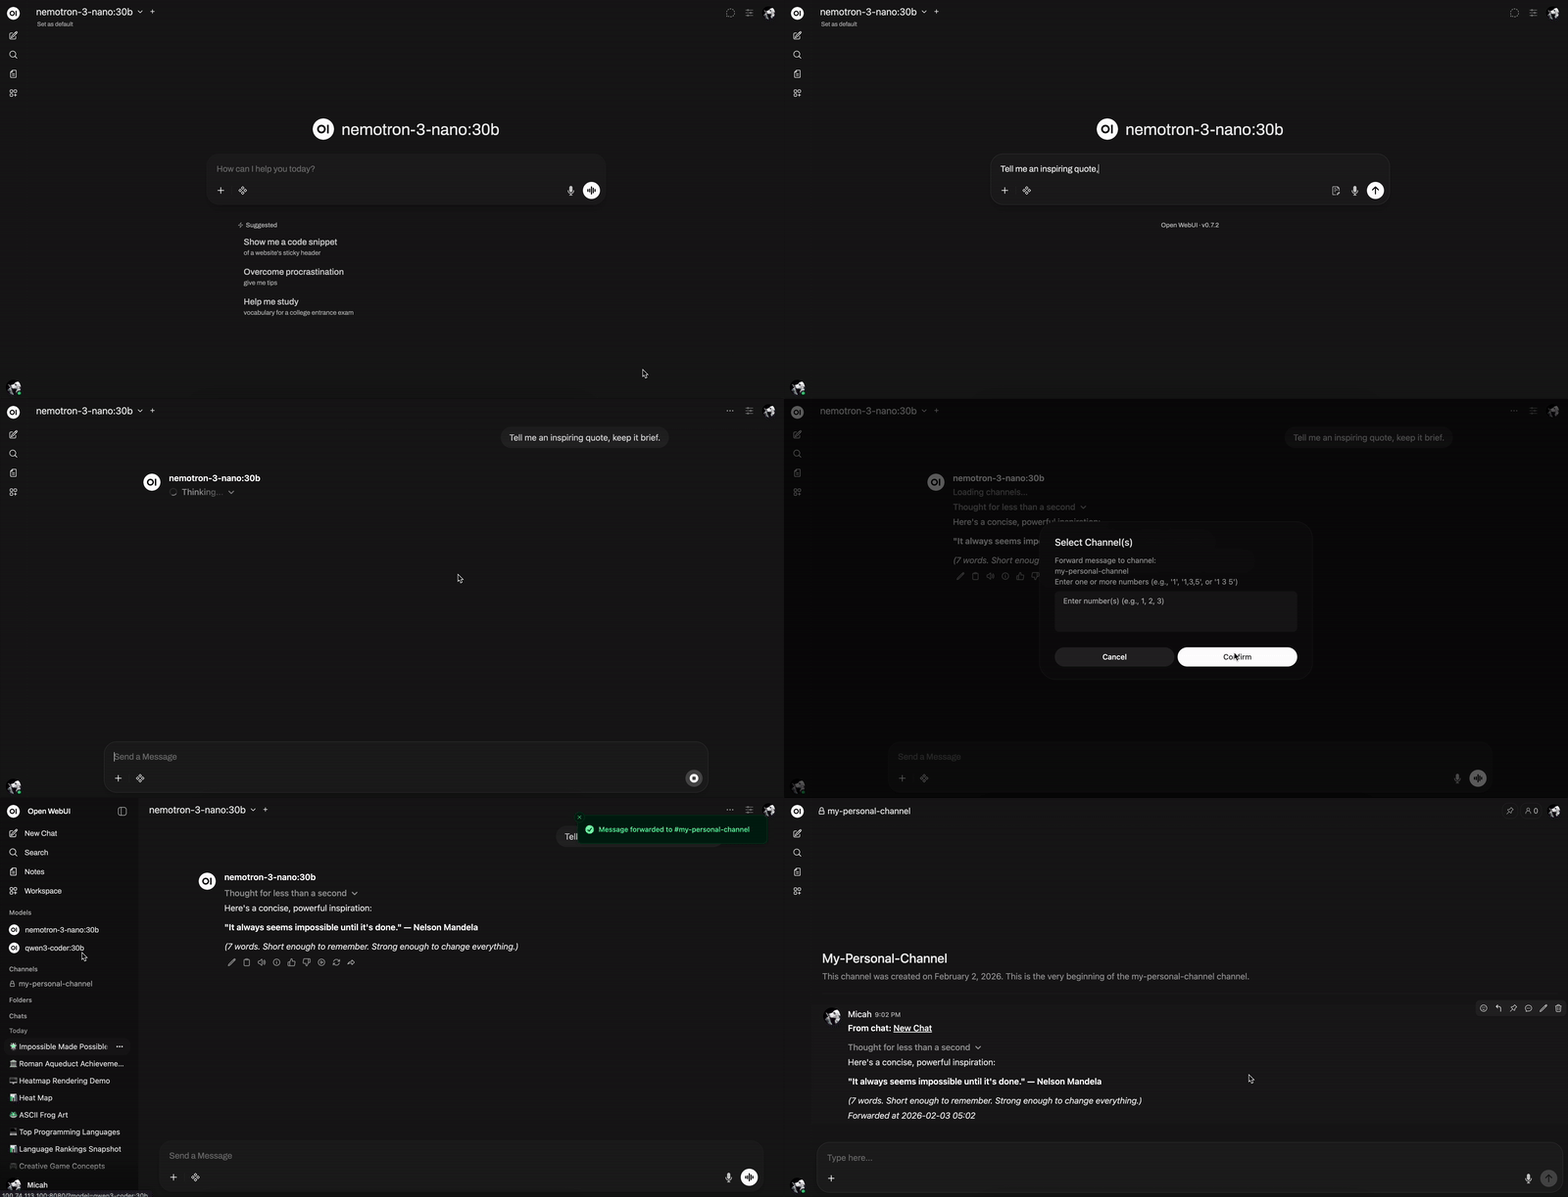
You've just gotten the perfect response, the one that answers the question your team has been stuck on for two days. Now you need to share it. You copy, paste into Slack, watch the formatting break, manually fix the code blocks, realize the bullet points are gone, give up and screenshot it instead.
This action adds a button: click, select a channel, done. Message arrives formatted correctly.
Requires Channels (the beta in-app messaging feature). If you haven't enabled it yet: here's how. If you're not using Channels, skip this one, it doesn't apply to you.
To install any of these: Click "Get" on the post page. Done.
From the Community#
@cyborg01's Dream Setup: NVIDIA DGX Spark#
Not a tool, a conversation.
NVIDIA's DGX Spark puts serious AI compute on your desk, the kind of setup that used to require a data center. @cyborg01 asked the community what they'd run on it. The thread turned into architecture debates, model wishlists, and real talk about what "local-first" looks like when hardware isn't the constraint.
Worth reading if you like thinking about what's possible when hardware isn't the bottleneck.
This Week's Leaderboard#
2,557 messages across 53 models. Here's where the usage went.
Top Models (7-day)
| Rank | Model | Messages | Change |
|---|---|---|---|
| 1 | mistral-small3.2:24b | 726 | +3721% |
| 2 | gemma3:27b | 325 | — |
| 3 | home-network-helper-deepseek-v3 | 165 | — |
| 4 | qwen3:235b-a22b-instruct-2507-q8_0 | 154 | +305% |
| 5 | cogito:14b | 138 | +41% |
The story this week: local models are winning. Mistral Small 3.2 at 24B went from nearly nothing to the top spot—a 37x increase. The top five are all self-hosted. You have to scroll down to #16 to find gpt-4.1-mini, which dropped 86%. GPT-5.2 is at #17, down 93%.
Top Countries
| Rank | Country | Messages |
|---|---|---|
| 1 | 🇮🇹 Italy | 2,534 |
| 2 | 🇺🇸 United States | 931 |
| 3 | 🇦🇹 Austria | 473 |
| 4 | 🇫🇷 France | 412 |
| 5 | 🇬🇧 United Kingdom | 388 |
Italy is leading substantially. If you're reading from Italy, what's happening over there? Genuine question.
Note: This data is opt-in. It reflects users who've enabled stats sync, not the full user base.
For Those Who Run Things#
Open WebUI Benchmarks Repository#

If you administer an Open WebUI deployment, especially one with multiple users, we've released an official benchmarks suite.
It measures:
- Concurrent user capacity
- Feature-specific performance limits
- Response latency under load
And it generates reports you can actually act on.
If you've wondered why things slow down at certain times, or you're planning for scale, start here.
That's It for This Week#
Three tools. One discussion. One resource for admins. And a leaderboard that tells an interesting story.
Get involved:
- Install this week's picks — try Smart Mind Map, Visuals Toolkit, or Forward to Channel
- Join the leaderboard — sync your stats and see where you land
- Share what you've built — we review every post for the newsletter
We've got some exciting updates in the works—both for the core platform and the community. More on that soon.
See you next week.
The Open WebUI Team